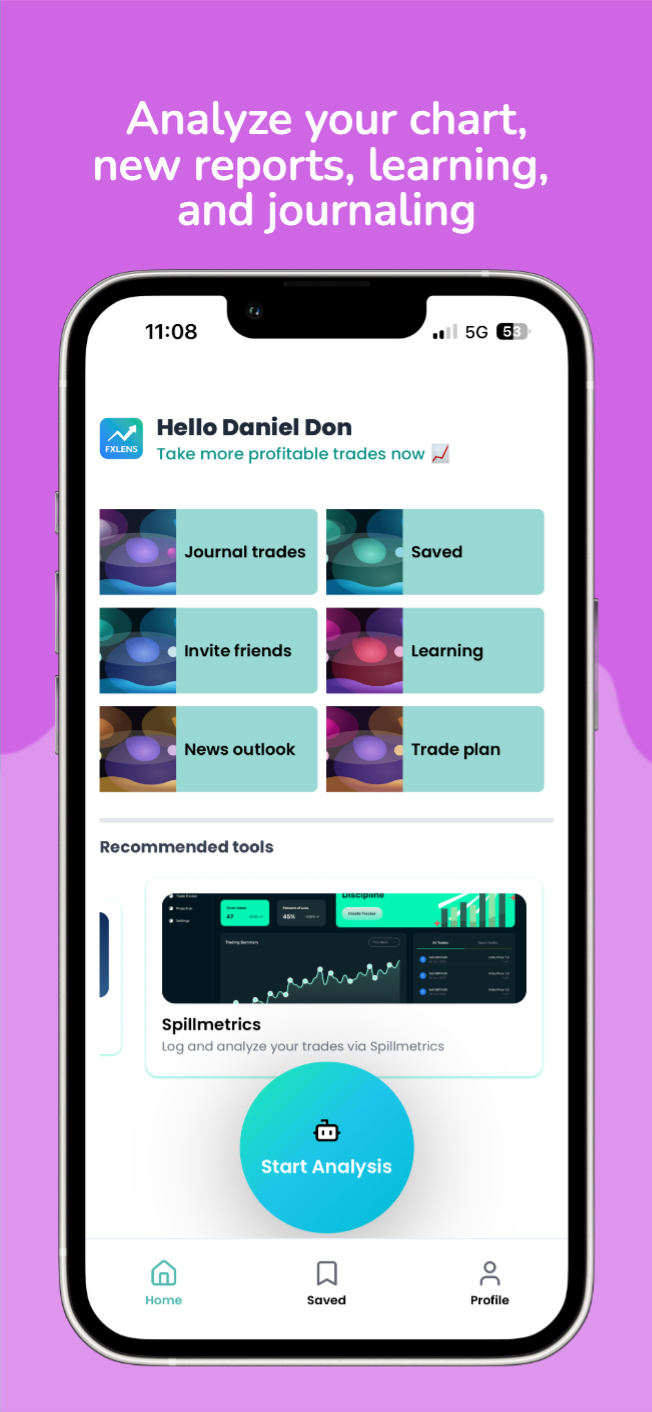
Turn screenshots into trades you can stick to
Upload you 4H + 15M charts, get instant analysis, map a trade plan, log outcomes, explore setups, and see news bias - everything you need to trade faster and smarter.
Why traders stick with FxLens
Execution beats prediction. FxLens speeds up prep, clarifies risk and keeps you honest.
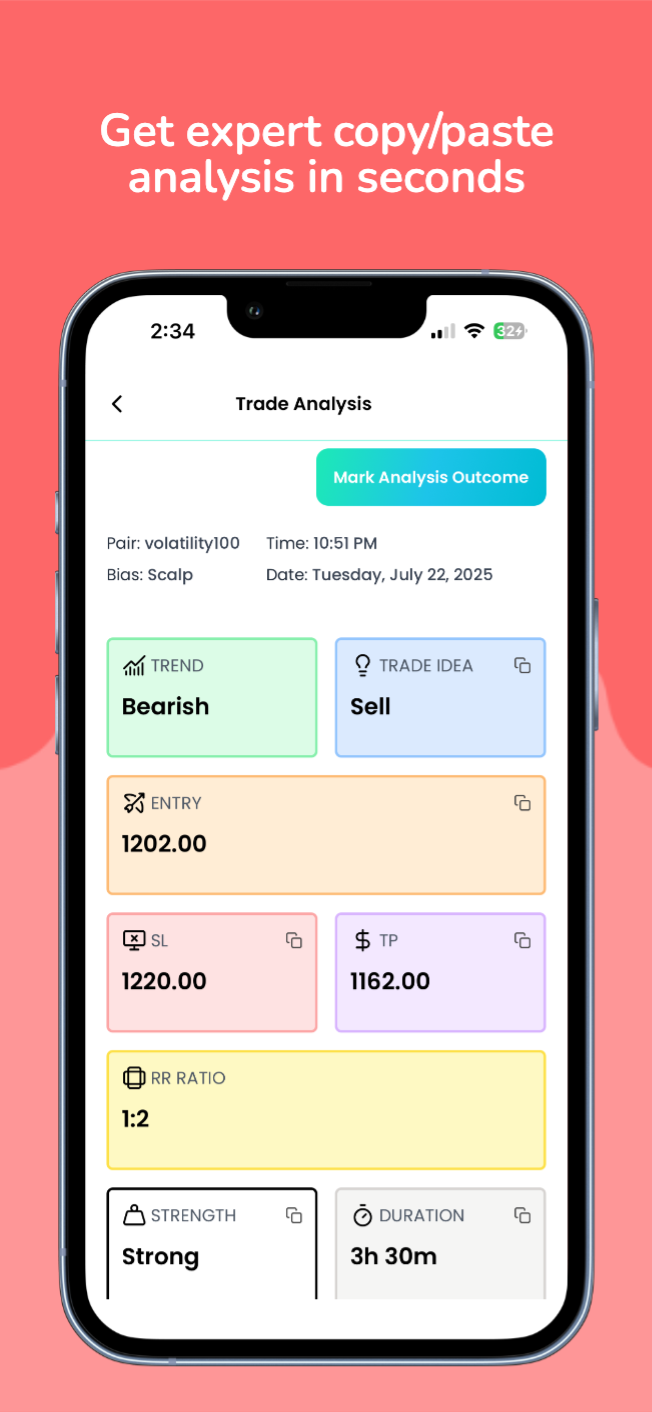
AI chart analysis
Upload your 4H and 15M screenshots. Get bias, entries, SL/TP, RR, strength and duration in seconds.
Personal trade plan
Set goals, risk limits, instruments and session rules. Turn discipline into a repeatable edge.
News with AI bias
High-impact events explained in simple words, with directional bias for linked pairs.
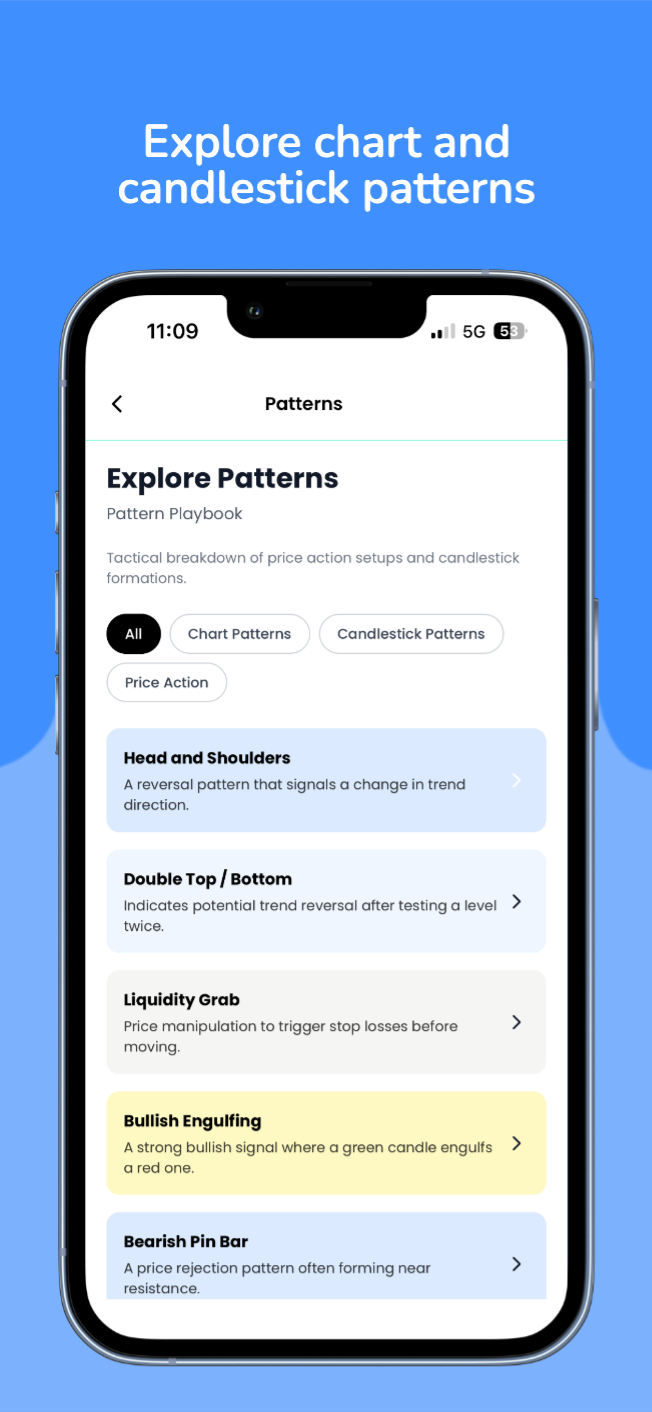
Learning library
Clean breakdowns of chart patterns and candlestick signals with real trade context.
Trade journaling
Log setups and outcomes. Track execution quality and spot patterns that move your PnL.
Spillmetrics ready
Send trades to Spillmetrics and share metrics with mentors or your trading circle.
How it works
Three quick steps from chart to action.
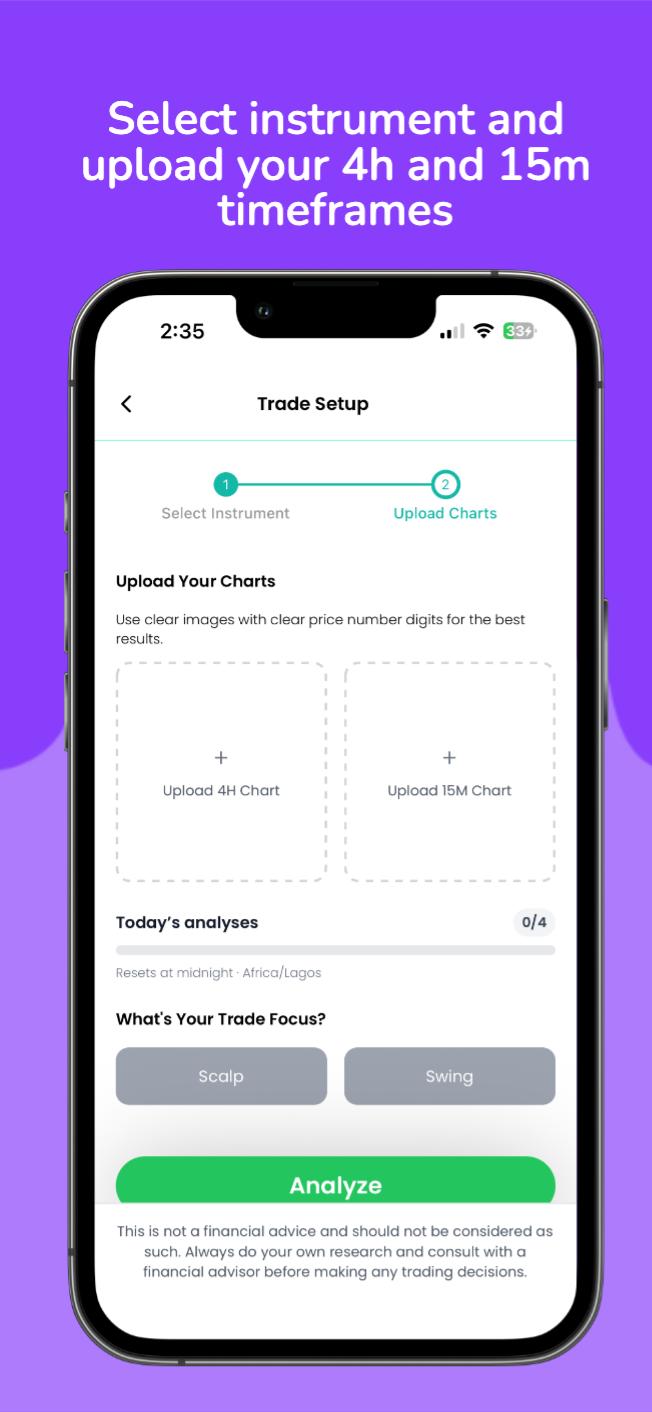
Pick instrument and upload charts
Use clear images with visible price digits for the best results.
Get a copy-and-paste analysis
Bias, entry, SL/TP, RR, strength and duration — ready for your plan.
Execute and journal
Stick to your rules, track outcomes and improve with each setup.
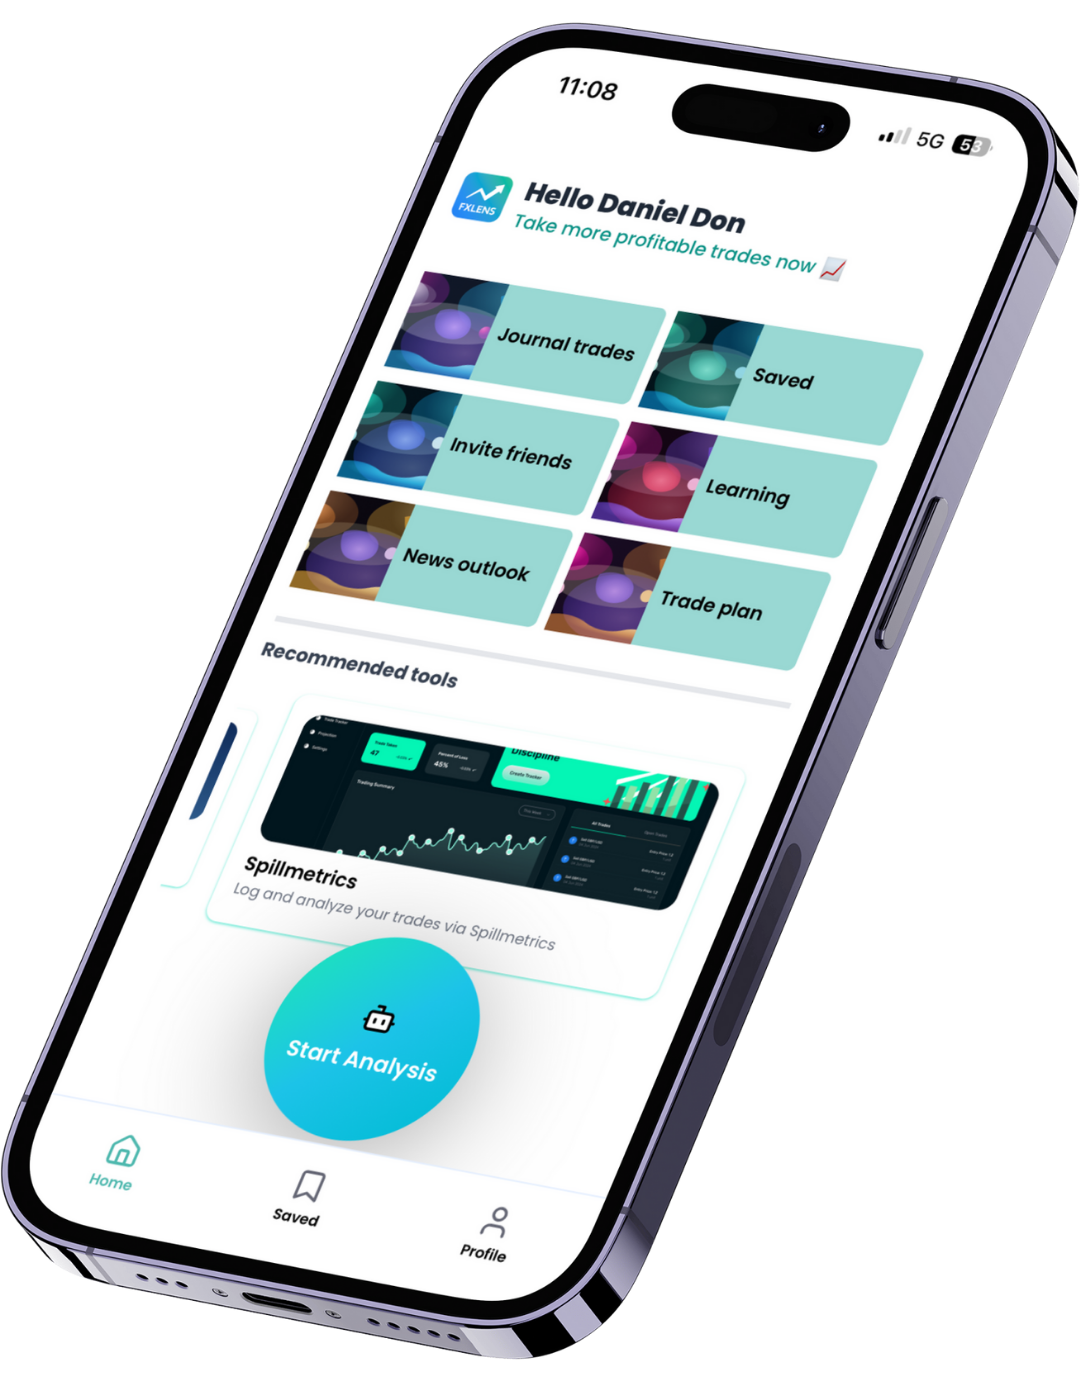
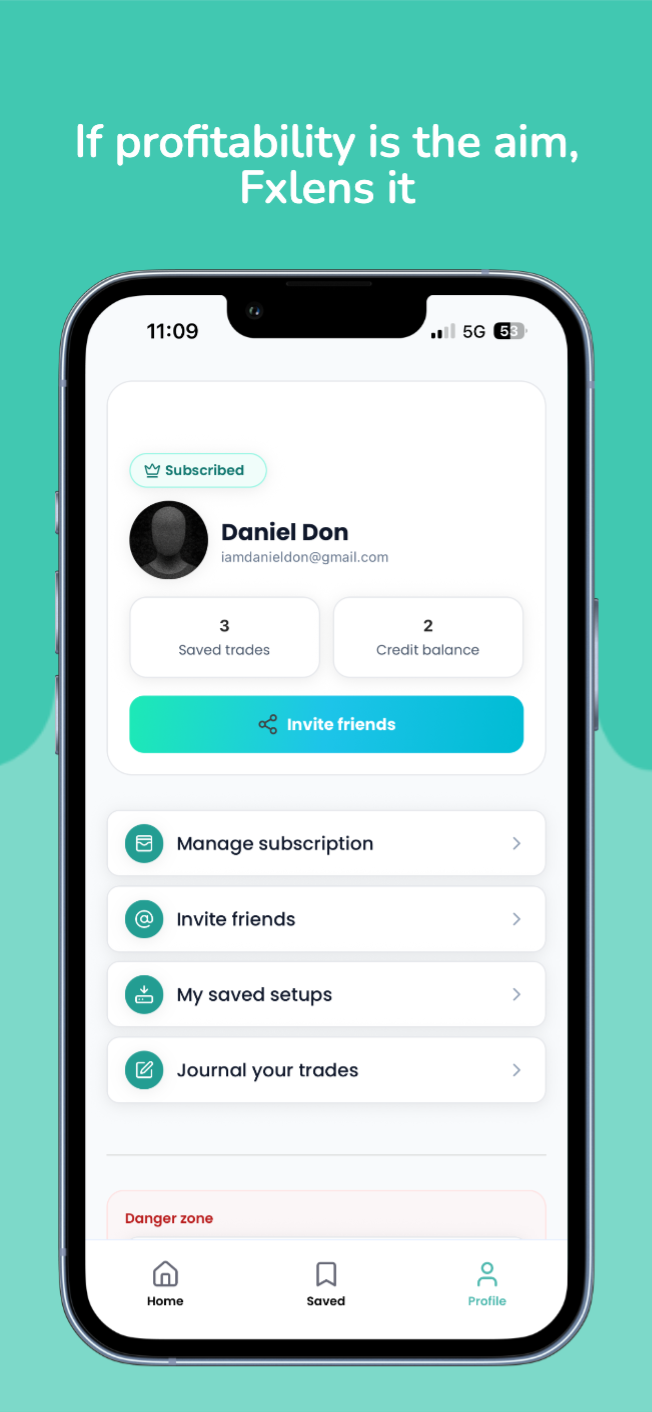
Inside the app
A quick look at the core screens.
Start trading with clarity
Install FxLens and make better decisions in less time. Your edge is discipline plus clear signals — get both in one place.

This is not financial advice. Always do your own research and consult a financial advisor before trading.